
Valuing a Stock with the DCF Method
Financial ratios and multiples – including metrics like price-earnings ratio and return on equity – provide a quick way for investors to determine the general value of a stock compared to other investments in the market. If you want to estimate the absolute value of a company, however, discounted cash flow (DCF) analysis can come in handy. It takes into account the time value of money – the idea that the money that’s available today is worth more than the same amount in the future because of its potential earning capacity.
DCF analyses use future free cash flow projections and discounts them, using a required discount rate, to arrive at present value estimates. A present value estimate is then used to evaluate the potential for investment. If the value arrived at through DCF analysis is higher than the current stock price with good margin of safety, the opportunity may be a good one.
The real formula to perform a discounted cash flow is:
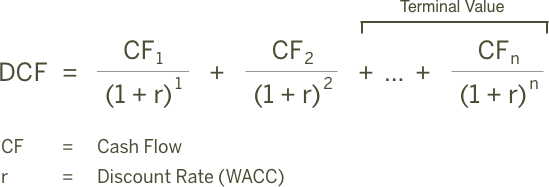
Now this formula will excite a few, but for the rest, my advice is to just understand what a DCF calculation is and what variables you need to include and adjust. We will go through each of the variables below with the example of RGB, a company listed in Malaysia:
- Start Value – Cash Flow & Earnings
- DCF Growth Rate
- DCF Discount Rate
- Adjusting Numbers – Debt & Cash
Start Value – Cash Flow & Earnings
The common starting point of DCF is Free Cash Flow. Hence, the name Discounted “Cash Flow”. Free cash flow is a measure of a company’s financial performance. It represents how much cash a company has left from its operations – cash that could be used to pursue opportunities that improve shareholder value, including acquisitions, new product development, debt reduction and paying dividends to investors. The formula for FCF is as below:
FCF = Cash from Operations – Capital Expenditure
In TRV Stock Analyzer, there are 9 options for the start value of the DCF valuation. These includes:
- TTM FCF
- 3 Years Average FCF
- 5 Years Average FCF
- 10 Years Average FCF
- TTM Earning
- 3 Years Average Earning
- 5 Years Average Earning
- 10 Years Average Earning
- Median of FCF & Earning
By default, the start value is set to “Median of FCF & Earning”. This figure is the median of TTM, short term and long term FCF and earnings for the stock. The figures are listed on the table on the right. You may choose the start value by clicking on the drop down menu.


You may also notice that we have included earnings in the DCF calculation. The reason for this deserve another post on its own. However, in short, with FCF being lumpy, it sometimes creates intrinsic values that are way off. There are also evidence that supports the idea that stock prices follow earnings than other forms of cash flow measurements because of the noise in cash flows. Things like accounting accruals, cash related transactions, changes in working capital and the ever changing needs of capex. Gurufocus has also tested the use of earnings in DCF and concluded that earnings seem to have higher correlation with the stock performances than the free cash flow, as most value investors believed. You may read the article here.
Personally, we do not use ONLY earnings in DCF, we may over-estimated the “cash flow” because not all earnings will be converted to cash. Hence, we use a long term and short term median of earnings and free cash flow.
If you would like to use your own starting value, you may key the figure into the yellow box. The point of the stock valuation is to be realistic, not pessimistic or optimistic.
In the case of our example of RGB, we will stick to using “Median of FCF & Earning” figure of close to 23mil. We can simply make a comparison with other figures. We can see that RGB has been generating good FCF for the past year (TTM), past 3FY and past 5FY.
In TTM, it generated 40mil of FCF from 26mil of earnings. In the last 3FY and 5FY, it generated 27mil and 24mil FCF respectively. We calculated the Median of FCF & Earning and come to a ficure close to 23mil. This figure seems to be realistic, not pessimistic or optimistic.
We will use this figure for DCF valuation. Remember, it’s not wrong to choose any figures as long as you know what you are doing.
DCF Growth Rate
Next, we need to determine how much the Cash Flow will grow next year, the year after next year and to the indefinite future. This is where we get to the artsy side of the DCF.
In the analyzer, we have prepared the DCF valuation to be a THREE STAGE DCF Valuation. You will have 3 growth rate – first 5 years (Y1 – Y5) growth rate, next 5 years (Y6 – Y10) growth rate and terminal growth rate.

Growth rate is calculated in the “Growth Rate” tab by calculating the median growth rate of several important financial figures. The growth rate will be used in the first 5 years (Y1 – Y5) growth rate. The analyzer assume that the growth rate will slow down on the next 5 years (Y6 – Y10), so the growth rate will be half of the first 5 years (Y1 – Y5) growth rate. Both the growth rate figure can be customized with your own figure by keying in the respective yellow cells.
Since it isn’t practical to forecast cash flows for an infinite number of years, it’s usual to end the DCF with a terminal value. We will need to determine the third growth rate which is the terminal growth rate. This is the growth rate for the cash flow from year 10 onward. Usually the best practise it to put the growth rate at inflation rate.
By default, it is set at 3% and should you require to change it, just key in the figure at the yellow cell.
You can always play around the valuation by changing the growth rate.
Whenever it is possible, it is best to value stocks based on the present data rather than what will happen in the future. Anything could happen even in 1 year, and if the growth rate is too high and the company cannot meet those expectations, there is no where to go but down.
The best practice is to keep growth rates as low as possible. If the company looks to be undervalued with 0% growth rate, you have more upside than downside. The higher you set the growth rate, the higher you set up the downside potential.
Growth rates doesn’t have to be accurate. Just be reasonable and use common sense.
In our example, the growth rate is set to default – 8.3% growth in first 5 years (Y1 – Y5) and 4.2% growth in next 5 years (Y6 – Y10). The terminal growth rate is set to 3%.
DCF Discount Rate
The purpose of a discounted cash flow is to find the sum of the future cash flow of the business and discount it back to the present value. To do this you need to decide upon a discount rate.
Simply put, a discount rate is another phrase for “rate of return”. i.e. what is your return requirement for this investment to be worth the risk?
You wouldn’t expect a return of 3% off your stock investment because you could easily get that from a fixed deposit or even just your normal bank account. If the bank risk free rate is at 3%, then why bother using 3% as a discount rate?
So what would be a good rate?
Considering that the “average” market return is about 8-12%, a minimum discount rate should be set to 8%. We would use 8% as a minimum for stable and predictable companies such as NESTLE while 12% is a good return for less predictable companies.
By default, the discount rate is set based on “Quality” Star in the “F – Dashboard” tab. The discount rate is set to 9% for Quality stars ≥ 4 or 10% for Quality stars < 4.
You may try to set an 8% discount rate for a stock and note its valuation then change the discount rate to 12%. As you can see the higher the discount rate, the lower the valuation because your required rate of return is much higher. This means that since you are willing to pay less now, you are placing more emphasis on the current cash flows of the company.
Adjusting Numbers – Debt & Cash
Once we have determined the start value, growth rate and discount rate, we can start the DCF calculation. With TRV Stock Analyzer, the calculation is automated.
To calculate the present value of the stock, we add up each year cash flow after considering growth and the terminal cash flow. We then discount it back to present value. Present value is then divided by basic share outstanding to get the present value per share.

From the picture above, we calculated the present value of RGB is at 0.2837 per share.
To get the final DCF valuation for the stock, we will have to add back the cash & short term investment and also deduct the debt for the company.

The final DCF valuation for RGB is 0.361.
With that, we have completed the stock valuation using DCF valuation model.
The margin of safety for the valuation is also calculated. In general, we usually aim to have a 30% margin on safety before making the investment. Never forget a good margin of safety. The best of us get it wrong as well.
![[User Guide] TRV Stock Analyzer Overview](https://trvanalyzer.com/wp-content/uploads/2017/09/Tutorial-Header-Overview-Tabs-500x383.png)
![[User Guide] “Home” Tab](https://trvanalyzer.com/wp-content/uploads/2017/09/Tutorial-Header-Home-Tab-500x383.png)
![[User Guide] “F-Dashboard” Tab](https://trvanalyzer.com/wp-content/uploads/2017/09/Tutorial-Header-F-Dashboard-500x383.png)

Leave A Comment